Performance Testing with JMeter
Harry
· 21 Sep 2026
· 1 views
Log in to track your progress and mark lessons complete.
Sponsored
 Browse All Tutorials
Explore →
Browse All Tutorials
Explore →
Introduction to Performance Testing
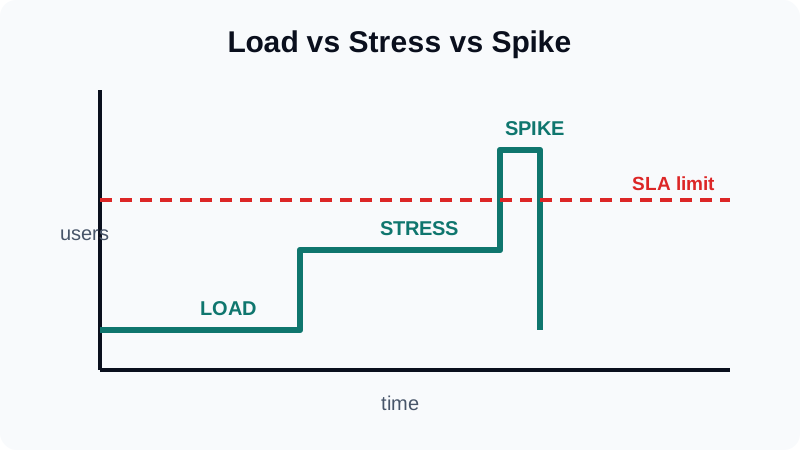
- Load - expected users (500 concurrent checkouts).
- Stress - beyond capacity until it breaks; find the ceiling.
- Endurance/Soak - long runs catch memory leaks.
- Spike/Volume/Scalability - sudden bursts, big data, horizontal scaling.
Key Metrics
- Response time (avg, p90, p99), throughput (req/sec), error rate.
- Server side: CPU, memory, GC pauses, DB slow queries.
- SLA example: p95 under 800ms at 500 users with under 1 percent errors.
JMeter: Your First Test Plan
- Test Plan -> Thread Group: 100 users, ramp-up 60s, loop 10.
- Add HTTP Request sampler: GET /api/books.
- Add Listener: Summary Report + Response Time Graph.
- Run, read aggregate report, find the slowest sampler.
Thread Groups, Assertions, Reports
- Thread Group - virtual users, ramp-up avoids a fake thundering herd.
- Assertions - fail samples on wrong status or missing text.
- Timers - realistic think-time between clicks.
- HTML dashboard - jmeter -g results.jtl -o report/ for shareable graphs.
- Test with production-like data volume, not 10 rows.
- Ramp gradually; spikes are a separate test.
- Always correlate slow endpoints with server metrics.