DevTools for Developers
Harry
· 13 Sep 2026
· 2 views
Open DevTools
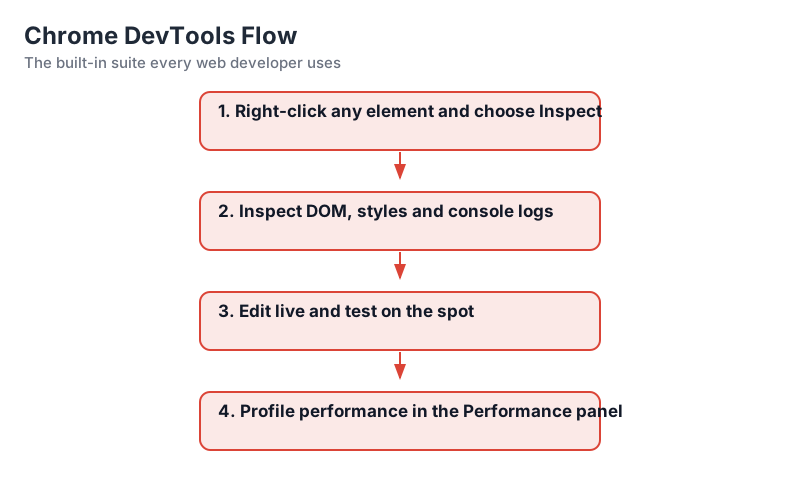
F12 or Ctrl+Shift+I opens Chrome DevTools, the professional debugging suite. Right-click > Inspect jumps directly to an element.
The Essential Panels
- Elements - Edit HTML and CSS live.
- Console - JavaScript errors, logs and REPL.
- Sources - Breakpoints and step debugging.
- Network - All requests, timing and payloads.
- Performance - Record and analyze runtime activity.
- Application - Storage, cookies and service workers.
Quick Workflows
In Elements, edit styles to preview before touching source. In Console, run $('body') to query the DOM and inspect objects. In Network, filter by type and reload to watch requests flow.
Lighthouse Audits
The Lighthouse panel scores performance, accessibility, best practices and SEO, and exports a full report.
Device Toolbar
Ctrl+Shift+M toggles responsive design mode so you test mobile breakpoints with throttled network directly in DevTools.
Key Points
- DevTools is bundled, no extension required.
- Elements + Network solve most front-end issues.
- Lighthouse grades the page for quality.
- Device mode approximates real phones.