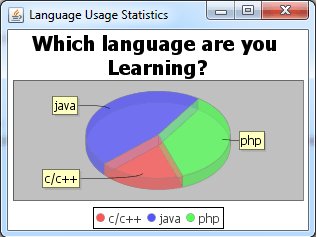
Introduction To JFreeChart
JFreeChart is a free and open source java chart library used for creating professional quality charts. JFreeChart is purely written in java language, we can very easily incorporate JFreeChart in our java standalone and web applications.
We can create a wide variety of both interactive and non-interactive charts using JFreeChart.
We can create various professional quality charts by using JFreeChart
- Single valued Charts(compass, speedometer, thermometer)
- Line Charts
- Pie Charts
- Bar Charts
- Wind Charts
- Polar Charts
- Bubble Chart
Features Of JFreeChart
- JFreeChart provide well-documented API, supporting a wide range of chart types.
- JFreeChart provides flexible design that is easy to extend, and targets both server-side and client-side applications.
- JFreeChart support for many output types, including Swing components, image files (including PNG and JPEG), and vector graphics file formats (including PDF, EPS and SVG).
- JFreeChart is "open source" i.e free software. It is distributed under the terms of the GNU Lesser General Public Licence (LGPL), which permits use in proprietary applications.
Requirements For Creating Chart Using Eclipse
Step 1 - Download JFreeChart jar file and JCommon jar file(used by JFreeChart) from http://sourceforge.net/projects/jfreechart/files/.
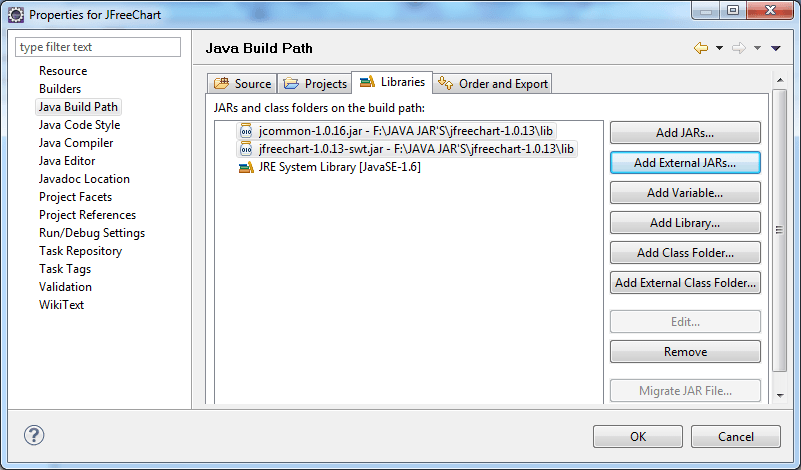
Step 2 - Add JFreeChart and JCommomn jar into classpath by rightclick on project >> properties >> java buildpath >> add external jars >> browse for JFreeChart and JCommon jar >> click OK.
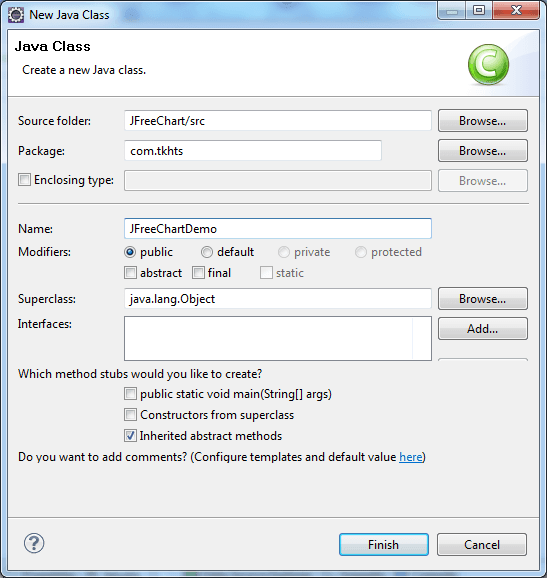
Step-3 Create java class by right-click on project >> New >> class >> class name >> finish.
Example Of JFreeChart
import javax.swing.JFrame;
import org.jfree.chart.ChartFactory;
import org.jfree.chart.ChartPanel;
import org.jfree.chart.JFreeChart;
import org.jfree.chart.plot.PiePlot;
import org.jfree.data.general.DefaultPieDataset;
import org.jfree.util.Rotation;

public class JFreeChartExample extends JFrame {

  public JFreeChartExample
  	(String frameTitle, String chartTitle) {
        super(frameTitle);
        //Creates a sample defaultPieDataset
        DefaultPieDataset defaultPieDataset =
        	new DefaultPieDataset();
        defaultPieDataset.setValue("c/c++", 19);
        defaultPieDataset.setValue("java", 46);
        defaultPieDataset.setValue("php", 35);

        // based on the defaultPieDataset
        // we create the chart
        JFreeChart pieChart =
        	ChartFactory.createPieChart3D(chartTitle,
        defaultPieDataset, true, true, false);
        PiePlot plot = (PiePlot) pieChart.getPlot();
        plot.setStartAngle(290);
        plot.setDirection(Rotation.CLOCKWISE);
        plot.setForegroundAlpha(0.5f);

        // Adding chart into a chart panel
        ChartPanel chartPanel =
        	new ChartPanel(pieChart);

        // setting default size
        chartPanel.setPreferredSize
        	(new java.awt.Dimension(300, 200));

        // add to contentPane
        setContentPane(chartPanel);
    }
    public static void main(String[] args) {
      JFreeChartExample chart = new
      	JFreeChartExample("Language Usage
      	Statistics", "Which language are you Learning?");
        chart.pack();
        chart.setVisible(true);
    }
}
Output: