
Using VisualVM
VisualVM is a visual tool integrating several command line JDK tools and lightweight profiling capabilities.
Designed for both production and development time use, it further enhances the capability of monitoring and performance analysis for the Java SE platform
It starts the VisualVM tool along with the monitored application and automatically opens the application tab after VisualVM startup.
or
VisualVM Launcher (Eclipse 3.5) (.zip, 42KB)
Designed for both production and development time use, it further enhances the capability of monitoring and performance analysis for the Java SE platform
VisualVM Features:
- Monitor local & remote Java applications
- Show configuration & environment
- Monitor performance, memory, classes...
- Monitor threads
- Profile performance & memory
- Take & display thread dumps
- Take & browse/analyze heap dumps
- Analyze core dumps
Eclipse launcher for VisualVM:
The Eclipse launcher for VisualVM is an Eclipse plugin to make monitoring and profiling Eclipse projects using VisualVM more convenient to the IDE users.It starts the VisualVM tool along with the monitored application and automatically opens the application tab after VisualVM startup.
Note:
The Eclipse launcher for VisualVM supports VisualVM 1.1 and newer; it won't work correctly with the older tool releases.Download
VisualVM Launcher (Eclipse 3.6+) (.zip, 39.7KB)or
VisualVM Launcher (Eclipse 3.5) (.zip, 42KB)
Usage:
- Create a new application configuration.
- Choose the "VisualVM Launcher" as the application launcher.
- Run Debug the application with the created configuration to have VisualVM started automatically.
Example:-
class SleepMessage
{
	public static void main(String args[])throws InterruptedException
	{
		//Step-1 keep the the data in a string.
		String importantInfo[] = (
			"Tools",
			"jconsole",
			"jps",
			"VisualVM",
			"NetBeans",
			"jstack",
			"jmap",
			"debugger",
			"profiler",
			"sampler",
			"disassembler",
			"jhat"
		);
		//Step-2 Repeat the String for the definite number of times
		for (int i = 0; i <importantInfo.length; i++)
		{
			//Step-3 Pause for 10 second
			Thread.sleep(10000);
			//Step-4 Print a message
			System.out.println(importantInfo[i]);
		}
	}
}
OUTPUT
Tools
jconsole
jps
VisualVM
NetBeans
jstack
jmap
debugger
profiler
sampler
disassembler
jhat
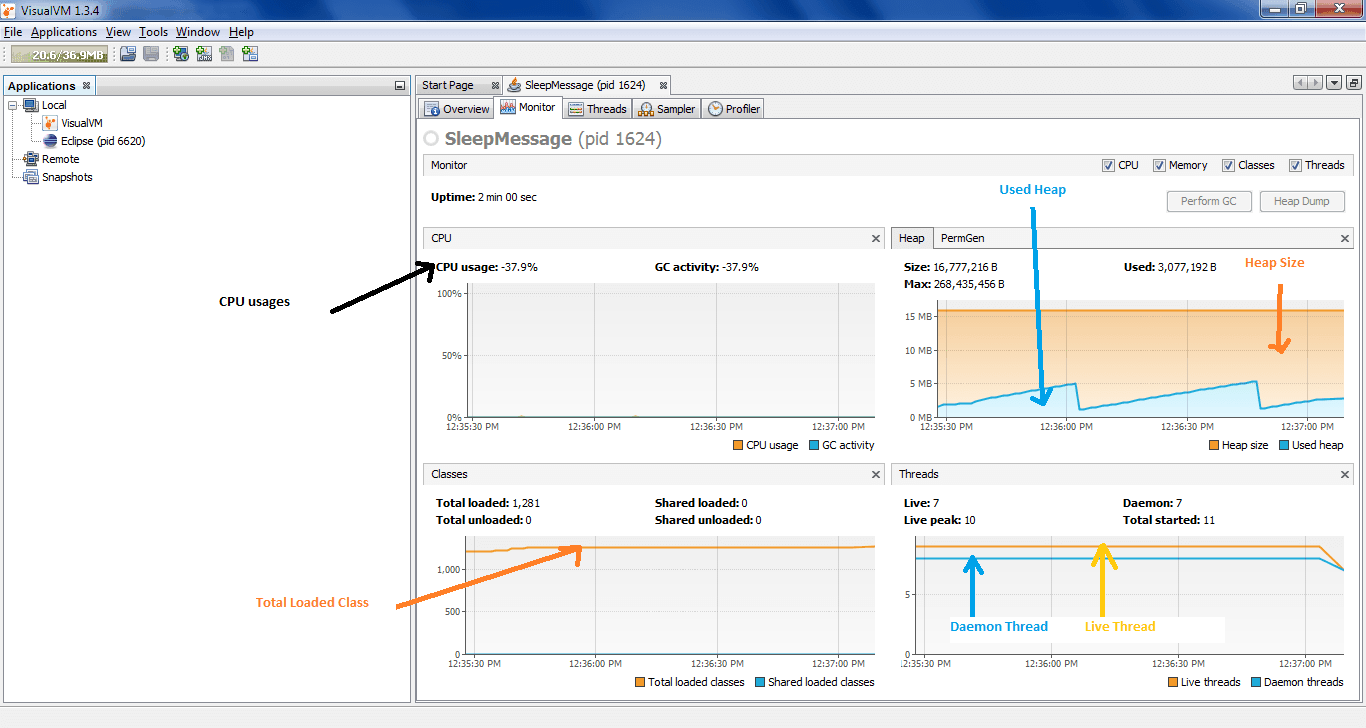
ScreenShot of VisualVM Using ProcessId(6268)

ScreenShot of VisualVM Using ProcessId(6268)
Viewing VM Information:
The VM Summary tab provides information about the Java VM.
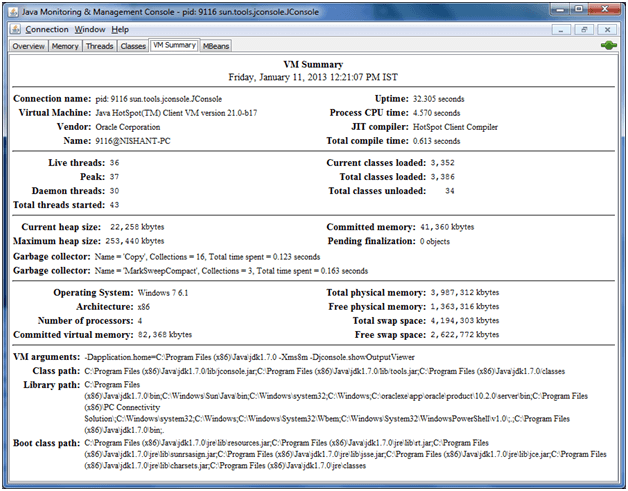
Uptime: Total amount of time since the Java VM was started.
Process CPU Time:Total amount of CPU time that the Java VM has consumed since it was started.
Total Compile Time: Total accumulated time spent in JIT compilation.
The Java VM determines when JIT compilation occurs.
The Hotspot VM uses adaptive compilation, in which the VM launches an application using a standard interpreter, but then analyzes the code as it runs to detect performance bottlenecks, or "hot spots".
Threads:-
Live threads: Current number of live daemon threads plus non-daemon threads.
Peak: Highest number of live threads since Java VM started.
Daemon threads: Current number of live daemon threads.
Total threads started: Total number of threads started since Java VM started, including daemon, non-daemon, and terminated threads.
Classes:-
Current classes loaded: Number of classes currently loaded into memory.
Total classes loaded: Total number of classes loaded into memory since the Java VM started, including those that have subsequently been unloaded.
Total classes unloaded: Number of classes unloaded from memory since the Java VM started.
Memory:-
Current heap size: Number of kilobytes currently occupied by the heap.
Committed memory: Total amount of memory allocated for use by the heap.
Maximum heap size: Maximum number of kilobytes occupied by the heap.
Objects pending for finalization: Number of objects pending for finalization.
Garbage collector: Information about garbage collection, including the garbage collector names, number of collections performed, and total time spent performing GC.
Operating System:-
Total physical memory: Amount of random-access memory (RAM) the operating system has.
Free physical memory: Amount of free RAM available to the operating system.
Committed virtual memory: Amount of virtual memory guaranteed to be available to the running process.
Other Information:-
VM arguments: Amount of free RAM available to the operating system.
Class path: The class path that is used by the system class loader to search for class files.
Library path: The list of paths to search when loading libraries.
Boot class path: The boot class path is used by the bootstrap class loader to search for class files.